Real run · public data
Sample report: Kahramanmaraş accuracy check
A validation run of the Orakta pipeline for Kahramanmaraş city centre, Türkiye after the earthquake of 6 February 2023, used to check the method against a well-documented event, not as a market. Built entirely from public data. The sharp optical pair inside the PDF is licensed for non-commercial use only and is not shown here.
- Place
- Kahramanmaraş city centre, Türkiye
- Coordinates
- 37.57500, 36.92500 (WGS84)
- Event date
- 6 February 2023
- After-period
- 7 February – 8 April 2023
- Report ID
- ea14f1e2574a
- Generated
- 13 November 2026
Result
Change signal above the local baseline
Radar change at the pin (6.93) is higher than 99% of the changes seen at this place in the same months a year earlier (4.55). This often matches structural damage, but needs an expert to confirm.
Requires expert review A screening indicator, not proof of damage, not a valuation and not a legal or engineering opinion.
- Change at the pin
- 6.93 maximum within 30 m
- Local control threshold
- 4.55 99th percentile, a year earlier
- Built-up area above threshold
- 76.8% within 300 m (60.1% of the whole area)
What the area looked like
The sharpest available pair
The report also contains the sharpest optical pair available for the pin. Its licence (CC BY-NC 4.0) allows non-commercial use only, so it is not reproduced on this website; it is listed with its scene IDs below.
Sharp satellite radar
Radar that shows the buildings, through cloud and at night
Commercial satellite radar at 0.41–0.43 m sees the buildings themselves, through cloud and at night. The pair below is an example from Iceland, not an Israeli case and not part of this report. The 10 m Sentinel-1 measurement behind the result is described in the PDF and on the method page; it is not shown as a picture.
Satellite radar example · Grindavík, Iceland, 2024 · not an Israeli case
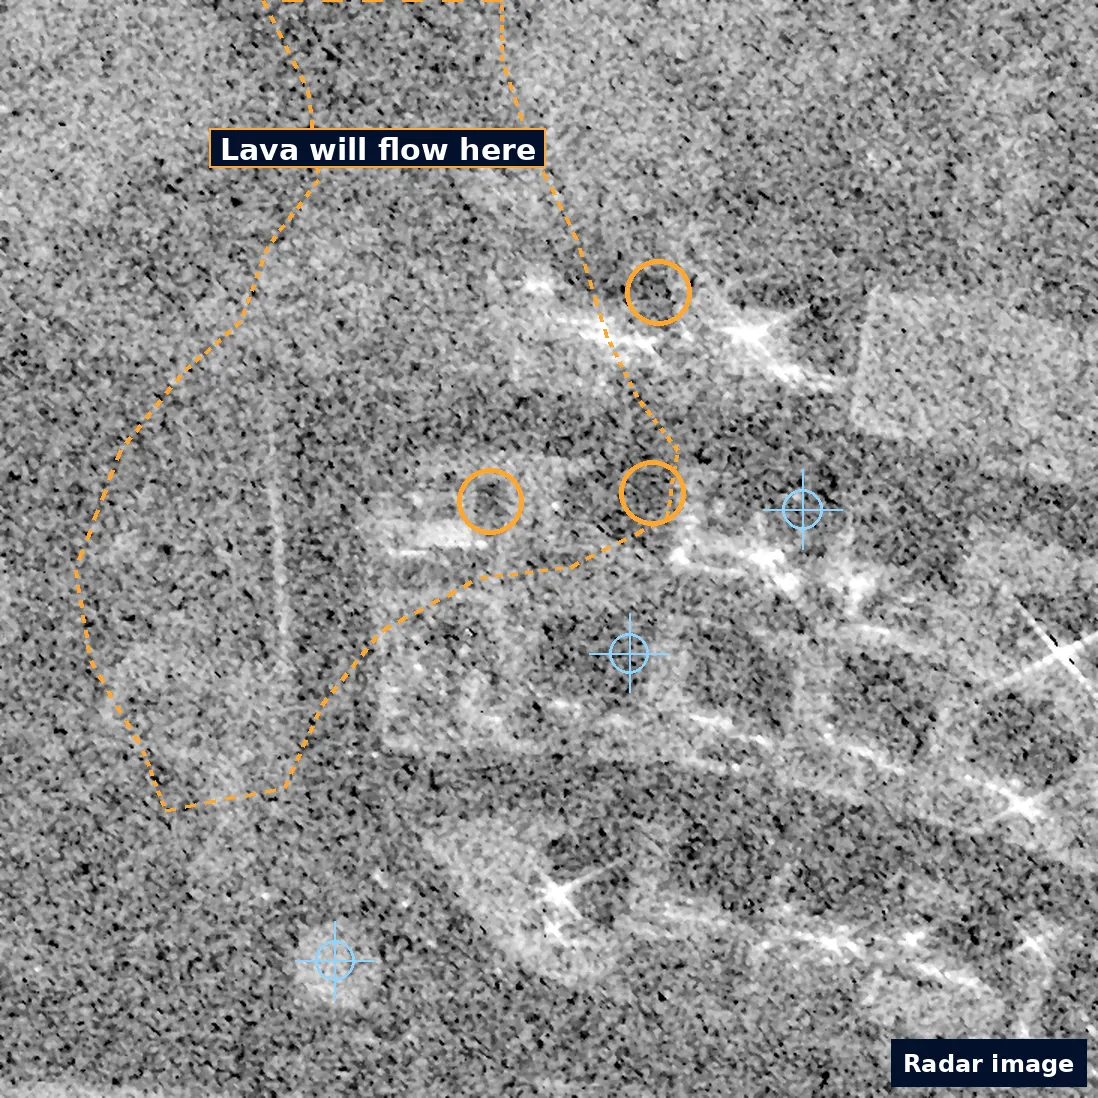
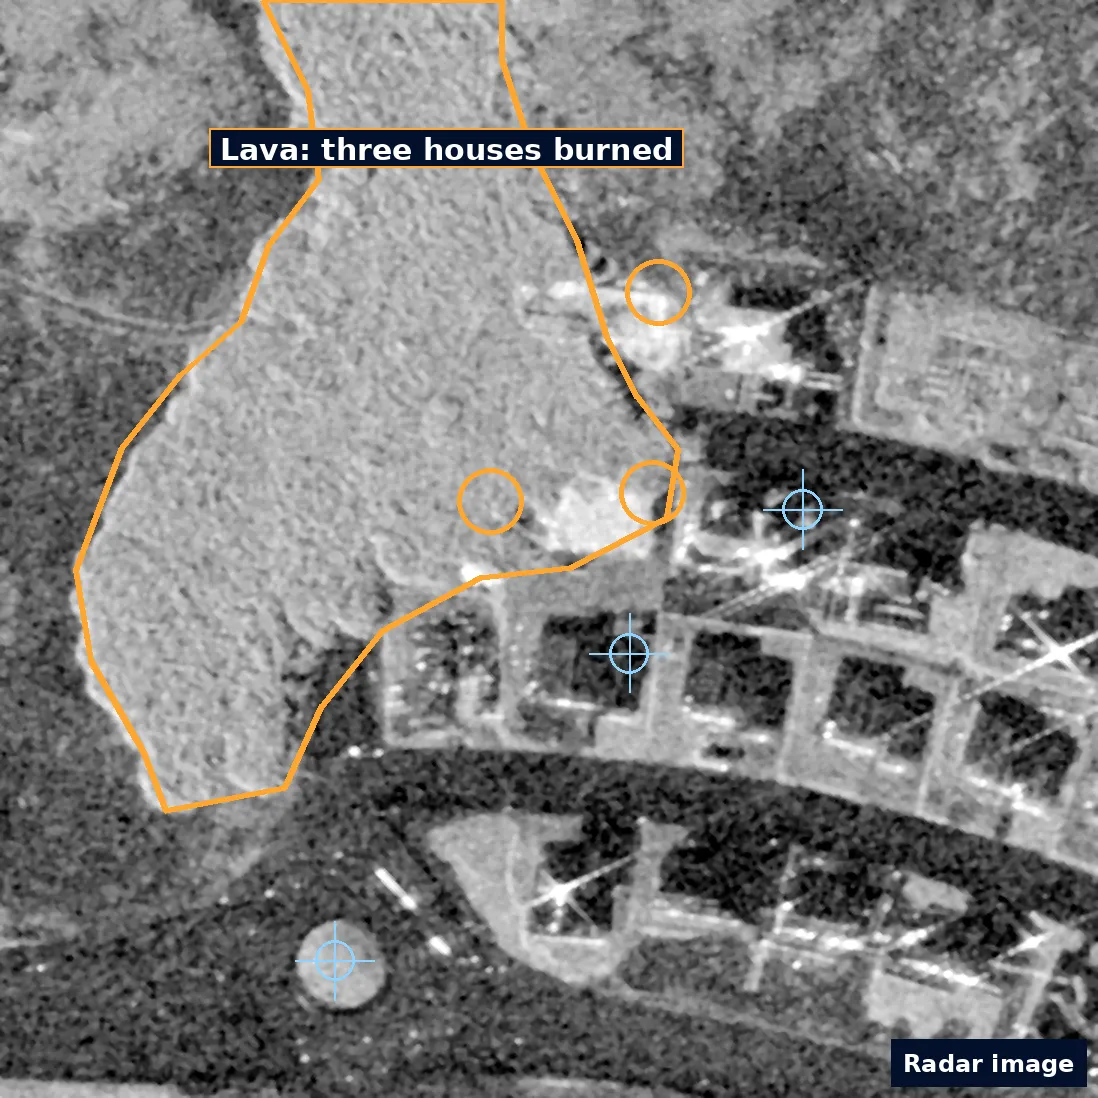
Satellite radar images, not photos. Amber: the lava edge (dashed before, solid after) and the three houses it burned on 14 January 2024. Blue crosses mark the same unchanged points in both images. The before image is grainier.
The PDF
What the report looks like
The first of four pages. The others cover the radar evidence, the method, known limitations and full provenance.
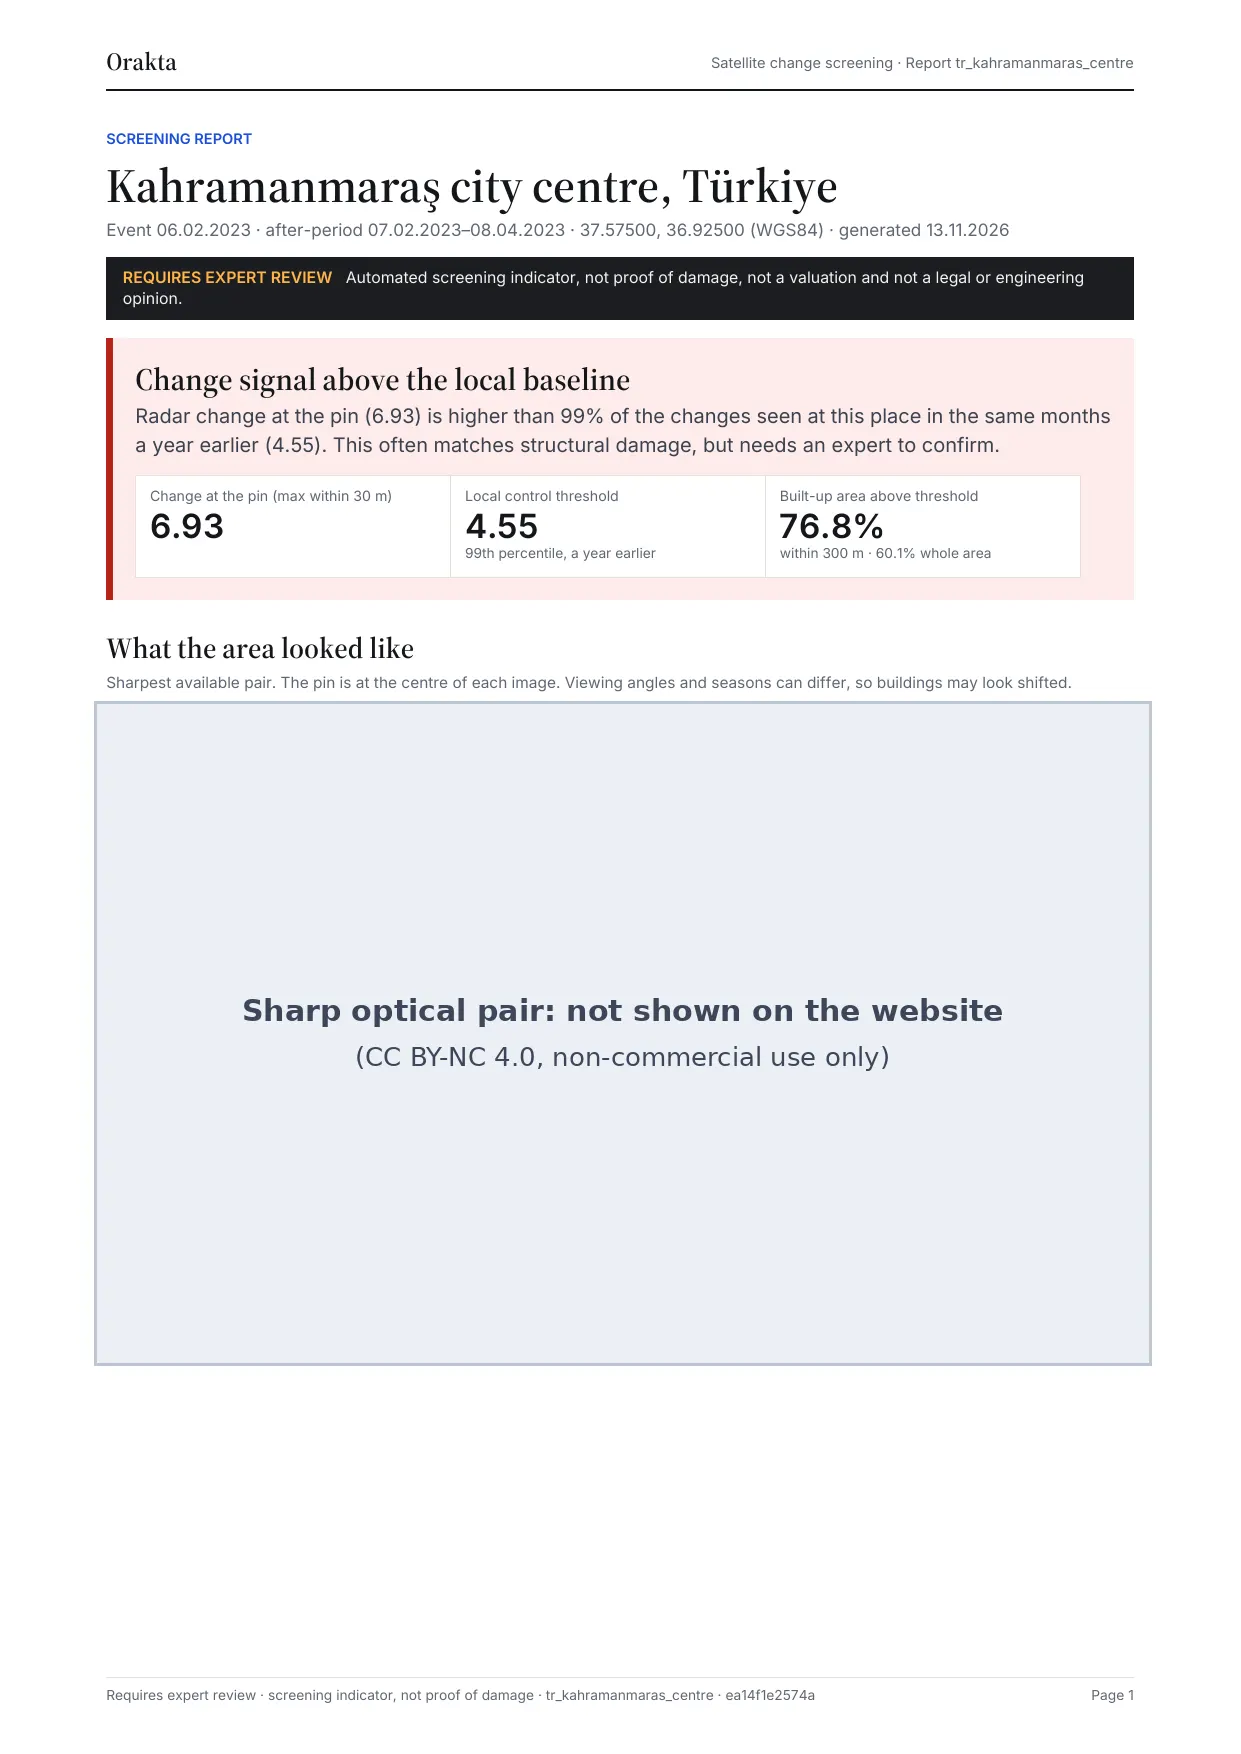
The sharp optical pair on this page (CC BY-NC 4.0, non-commercial use only) is masked on the website.
Provenance
Every scene named, every figure hashed
An excerpt from the evidence bundle. Anyone can fetch these scenes from the public archives and check the report figures against their SHA-256 hashes.
Scenes
- Sharp before
- 37/031131233233/10300100D797E100
- Sharp after
- 37/031131233233/10300500D9F8D200
- Radar before
- S1A_IW_GRDH_1SDV_20230128T153424_20230128T153449_046986_05A2B6
- Radar after
- S1A_IW_GRDH_1SDV_20230209T153423_20230209T153448_047161_05A88A
- Optical before
- S2B_MSIL2A_20220917T081609_R121_T37SCB_20220918T051514
- Optical after
- S2B_MSIL2A_20230624T081609_R121_T37SCB_20230624T133450
The radar baseline uses Sentinel-1A scenes from 3 orbits over the twelve months before the event; the full list is in the bundle.
Figure hashes (SHA-256)
- img_maxar_before.png
- 8638680ec06dd2565c22d106d9d06c157b5ef79edd5ba9f7d83f4d9f35afc7e3
- img_maxar_after.png
- 638bd2f9bc3b938cc1ed7f538c6ca15a72b25458cd76a7db0cde7ed1a60a1009
- s2_before.png
- 78a0f7c261502074e7475c628c5164766fa3d2270b8bc016fca2ac499a9e7b3d
- s2_after.png
- d64c516b618d9df49221d0016bd0beb7313fd16183bf03526916d29d0d7edeaa
- pwtt.png
- ab101d746805f652555159356c75dd8befdab478fa5e60802f209bdf6520e38d
- s1_pair.png
- af56f2a039ea961dc2657d7faa6d3c90bfa859863029ce32aa80cc9bb2ac5062
Hashes refer to the original report files. Images on this page are cropped and compressed for the web, so their own hashes differ.
Limits
Read before relying on it
- A radar pixel is about 10 × 10 m and can cover several buildings. The result is not a building-by-building damage assessment.
- Construction, demolition, debris clearing, vegetation and flooding also change radar and can look like damage.
- Light damage to windows, roofs or interiors is usually invisible from orbit.
- Sharp archive imagery exists only for some places and dates. When it is missing, the report says so.
- Viewing angles and seasons differ between images, so buildings can appear shifted.
Want a report like this for your address?
Send the addresses and the event date. The same business day, we tell you whether sharp satellite imagery exists and what a report would cost. Nothing is bought without your written approval.